Visualize a Model using ModelExplorer#
The visualization_utils.py contains functions for
visualizing ExecuTorch models as computational graphs using the ModelExplorer utility.
Installation#
To install the ModelExplorer and its dependencies, run:
./devtools/install_requirements.sh
Visualize a model#
The function visualize() takes an ExportedProgram and launches a ModelExplorer server instance. A browser tab will
open, containing the visualization.
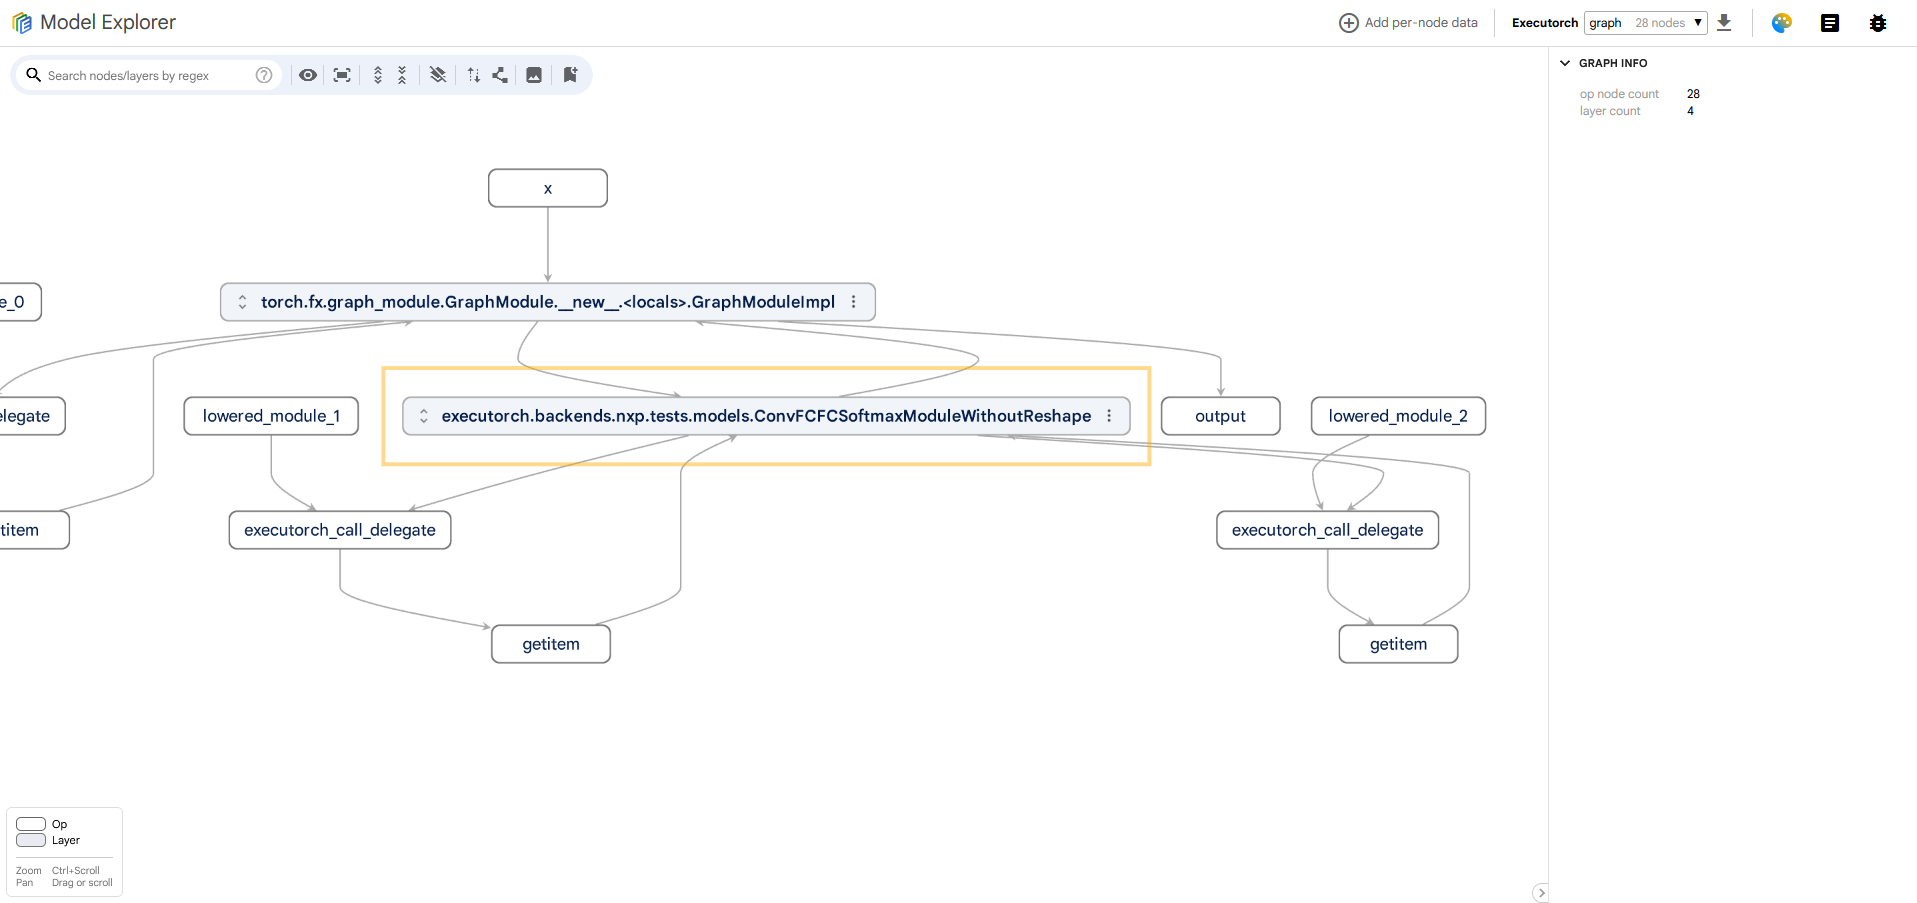
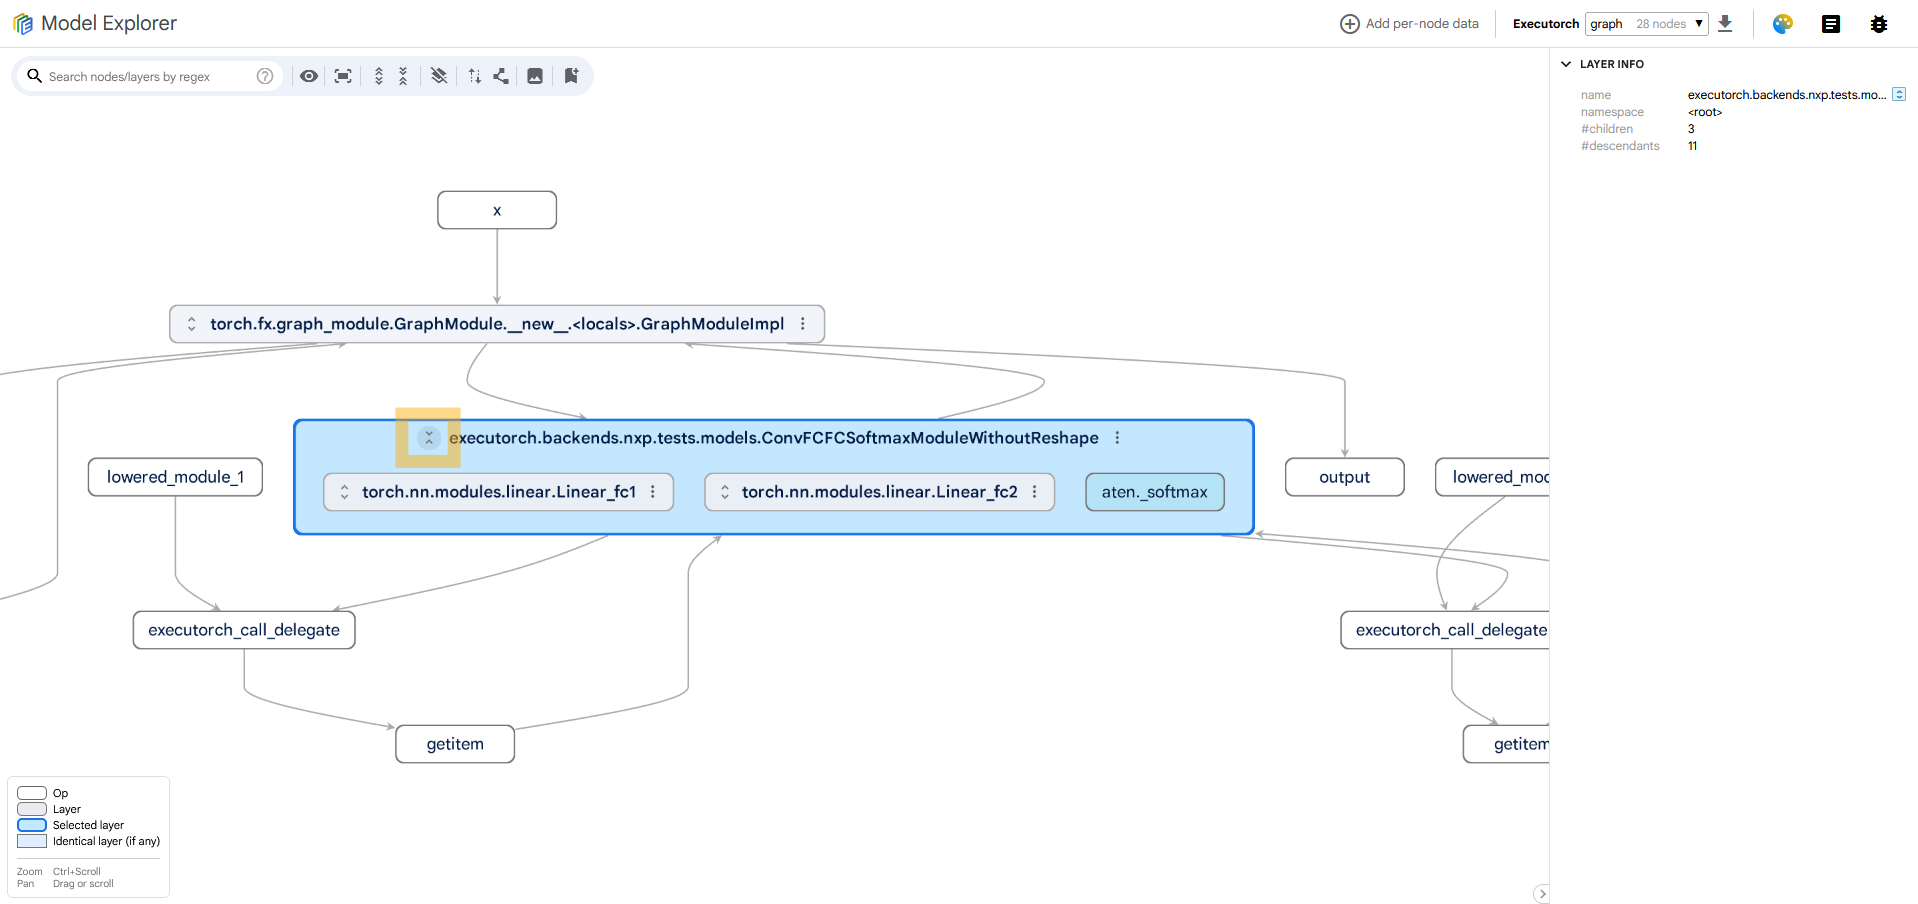
The operations in the graph will be grouped together into collapsable nodes, based on which nn.Module instances they
originate from (see Figure 1). These nodes can be expanded by clicking the button in their top
left corner, as shown
in Figure 2. The model can contain an entire hierarchy of collapsable nodes, reflecting its
original PyTorch
implementation (see Figure 3).
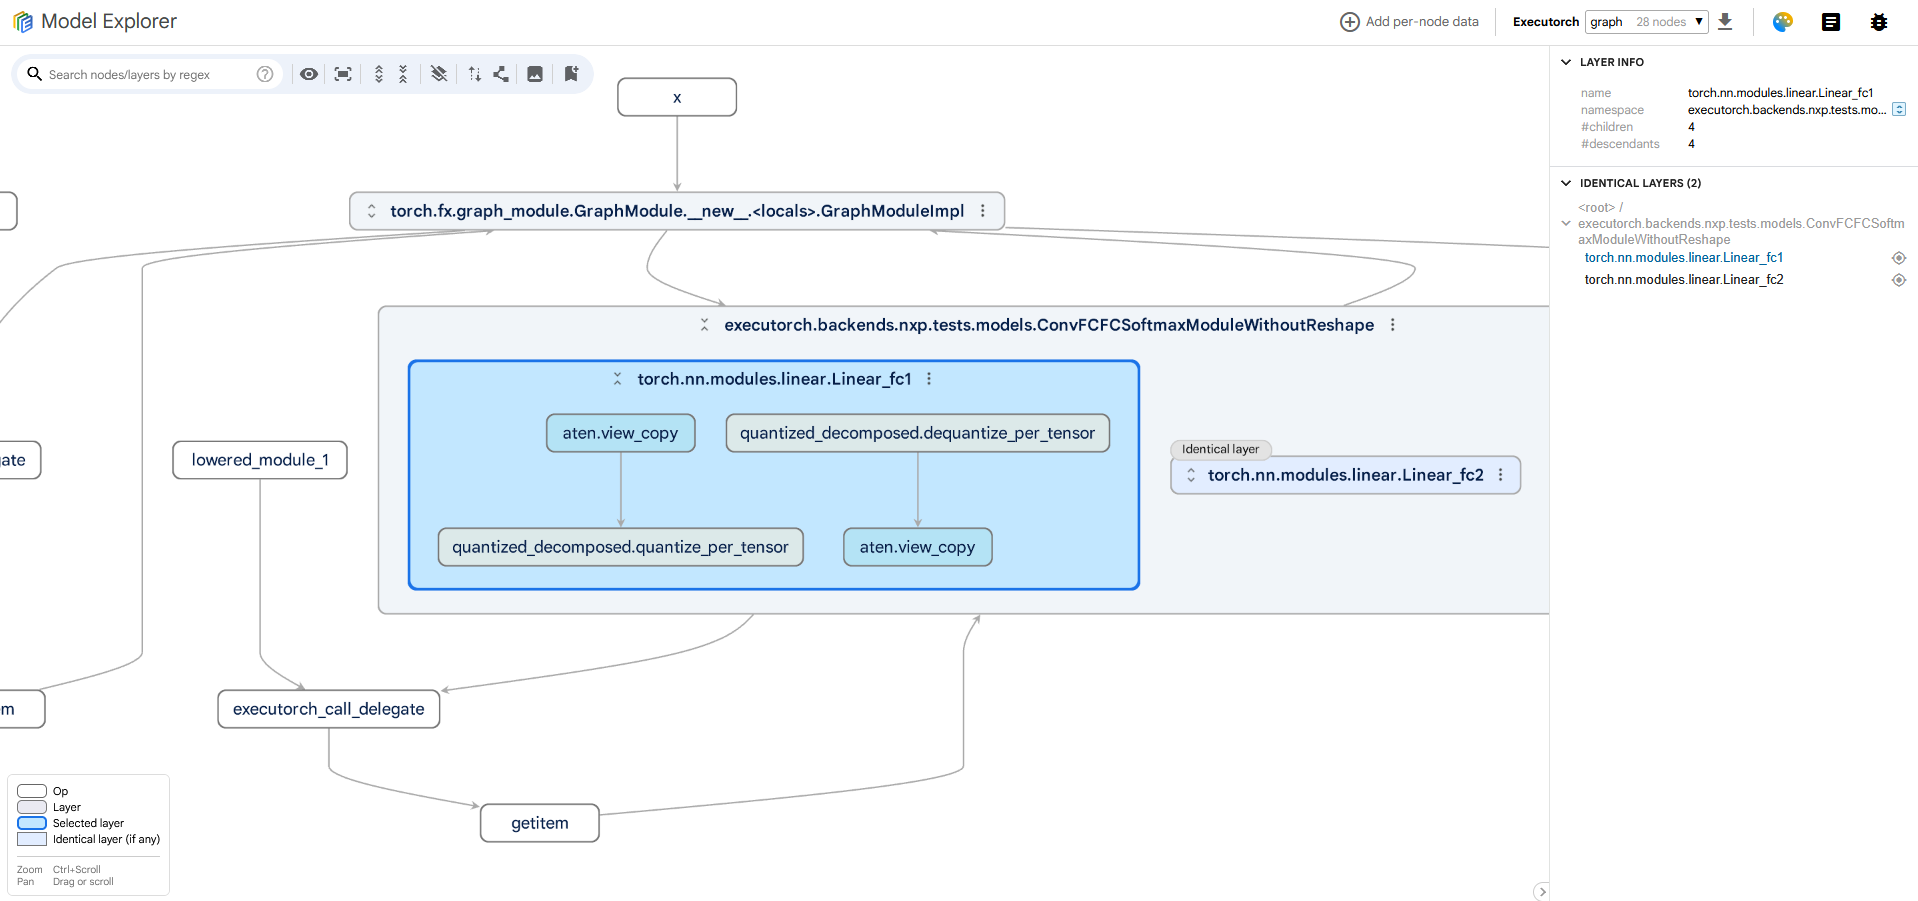
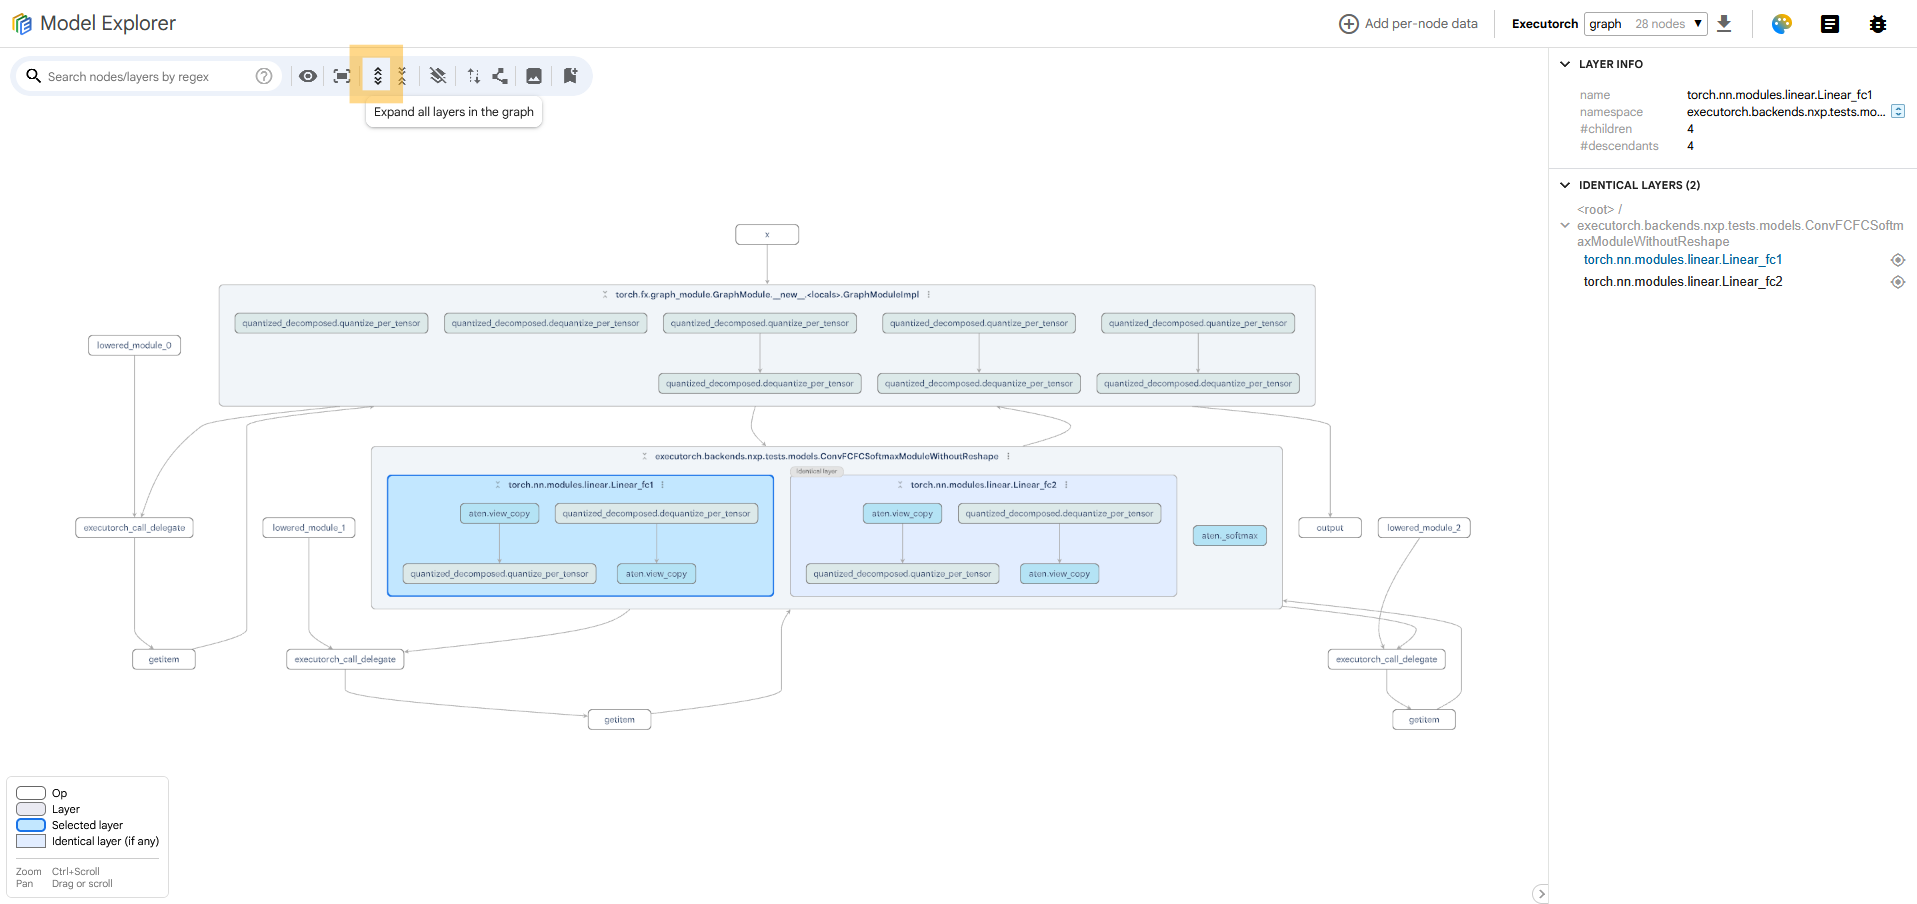
The Model Explorer GUI provides a button in the top left corner of the screen (see Figure 4
),
which expands all the nested expandable nodes. The result will display all the low-level operations, surrounded by
rectangles which indicate their membership to specific nn.Module instances.
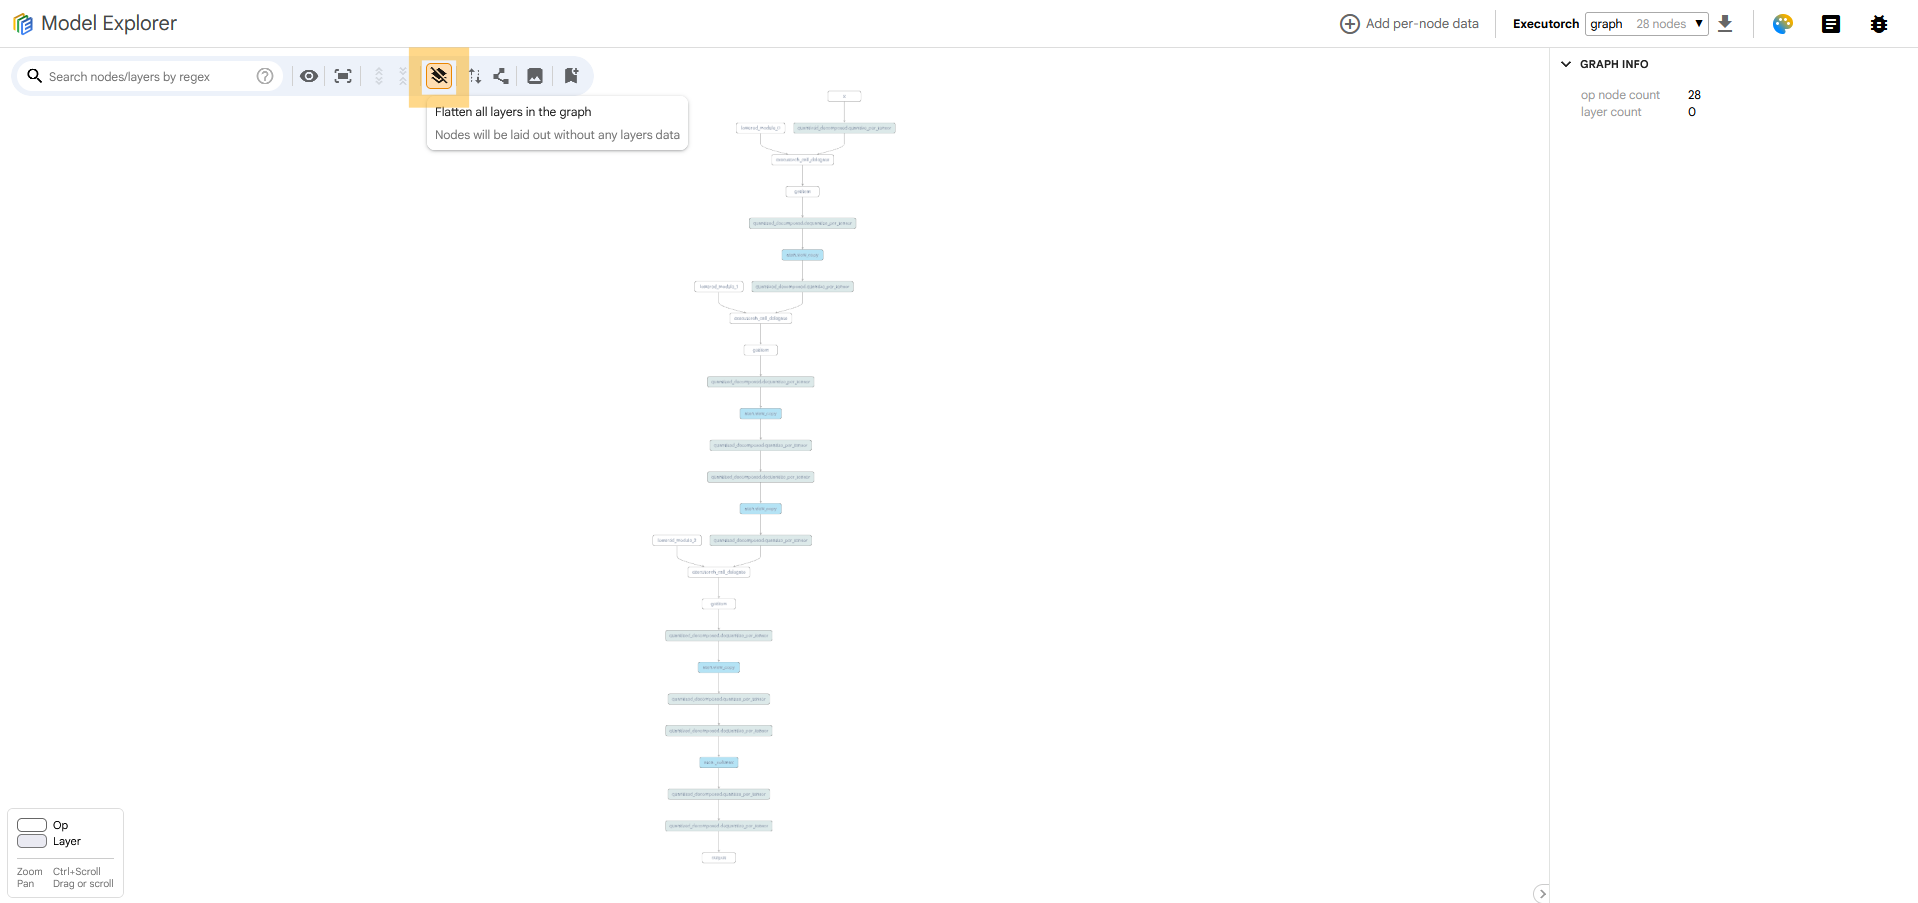
Sometimes, it is not ideal to view the model like this. Focusing on visualizing the origin of the final nodes can make
it harder to see the flow of data in the graph. For this purpose, a button in the top left corner can flatten all the
layers (expandable nodes), effectively hiding the original nn.Module instances and just displaying the model as a
computational graph (see Figure 5).
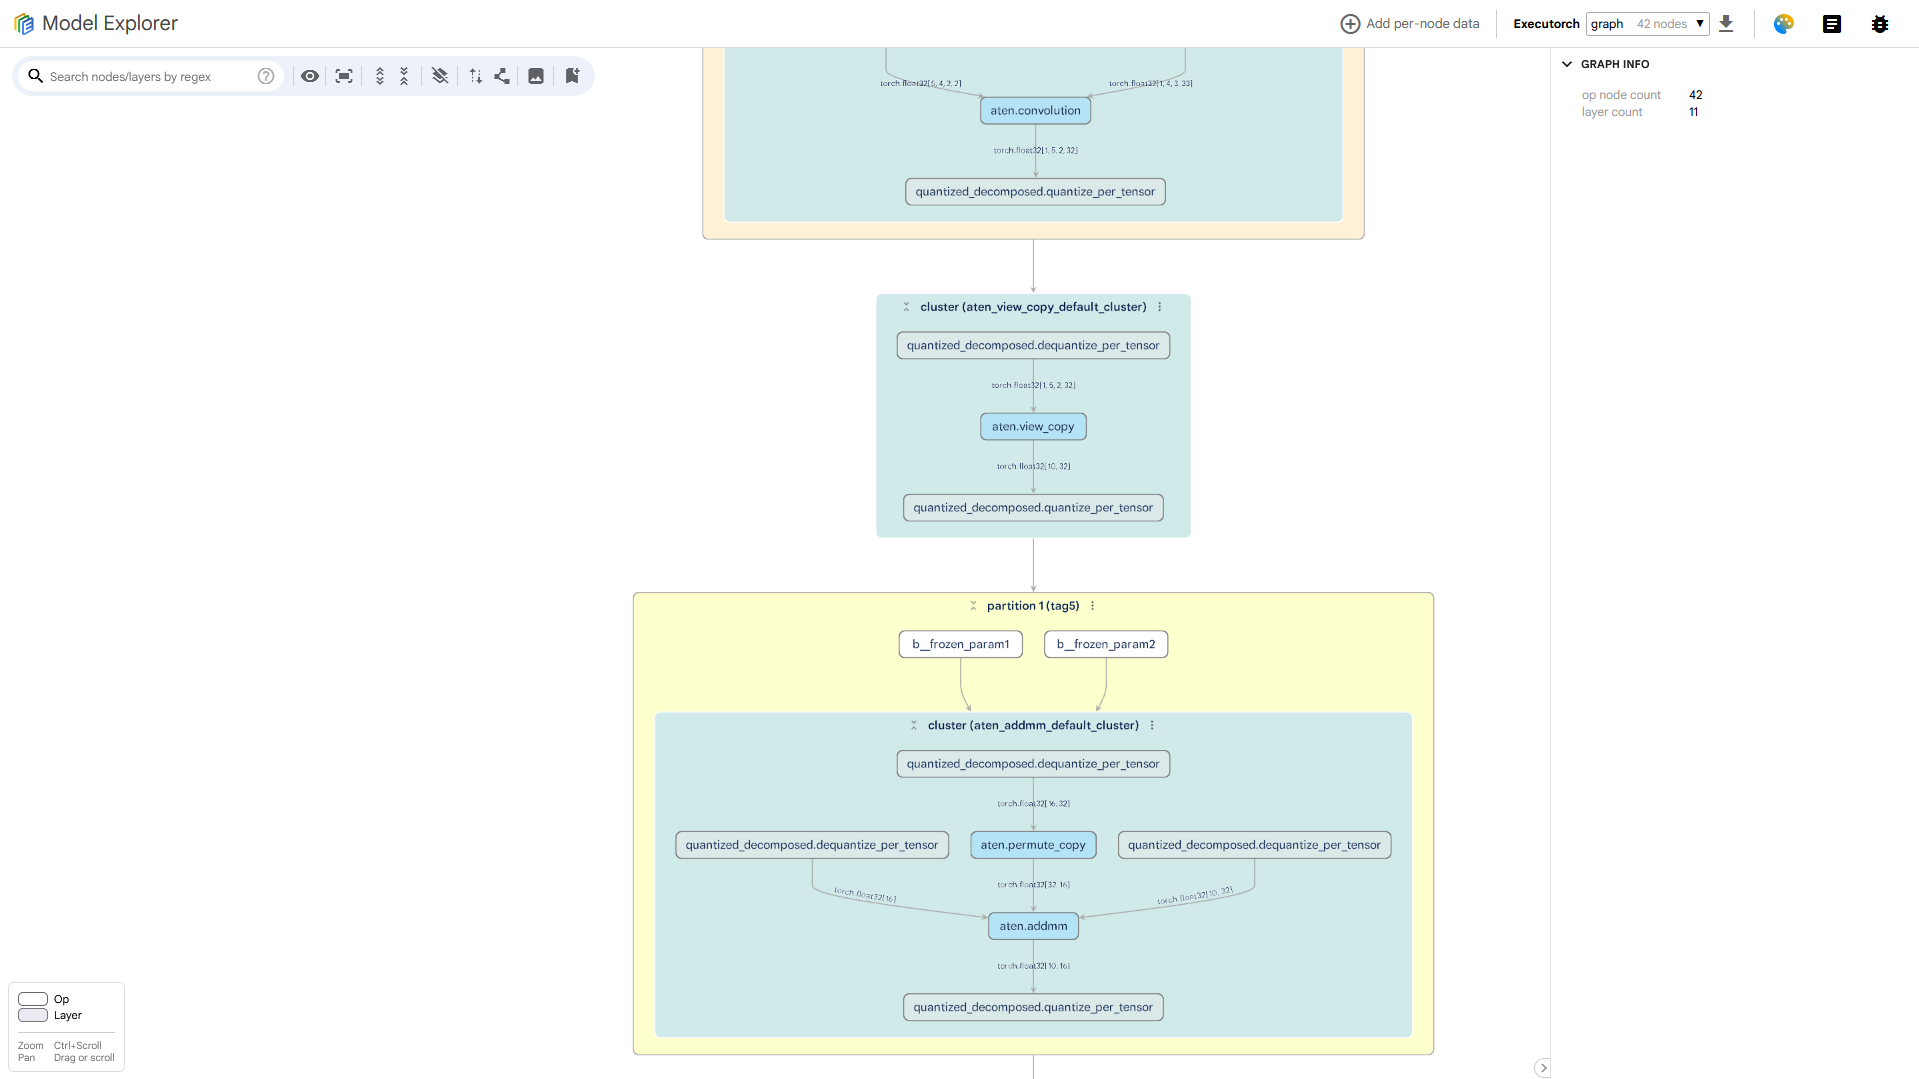
Visualize a Model with Highlighted QDQ Clusters and Partitions#
The visualization_utils.py contains the function
visualize_with_clusters() which takes an ExportedProgram and visualizes it using the ModelExplorer utility.
It groups QDQ clusters and individual partitions together to improve readability. Example usage is available
in examples/nxp/aot_neutron_compile.py.
An example of the visualization is shown in Figure 6.
Usage#
There are two main use cases for the visualization:
1. Launching the ModelExplorer and Visualizing the Model Immediately#
Call:
visualize_with_clusters(exported_program)
This starts a ModelExplorer server and opens a browser tab with the visualization.
By default, each call starts a new server instance and opens a new browser tab.
To reuse an existing server, set the reuse_server parameter to True.
Starting the server is blocking, so the rest of your script will not run.
2. Storing a Serialized Graph and Visualizing Later (Non-blocking)#
To save the visualization to a JSON file, call:
visualize_with_clusters(exported_program, "my_model.json")
This just saves the visualization in the file, and it does not start the ModelExplorer server. You can then open
the file in the ModelExplorer GUI at any point. To launch the server, run:
model-explorer [model-file-json]
If the model-file-json is provided, the ModelExplorer will open the model visualization. Otherwise, the
ModelBuilder GUI home page will appear. In that case, click Select from your computer, choose the JSON file,
and then click View selected models to display the graph.
Styling the Graph#
visualize_with_clusters() supports custom grouping of nodes into QDQ clusters and partitions.
You can pass the following optional parameters:
get_node_partition_nameget_node_qdq_cluster_name
These are functions that take a node and return a string identifying the partition or cluster it belongs to.
Nodes with the same partition/cluster string will be grouped together and labeled accordingly in the visualization.
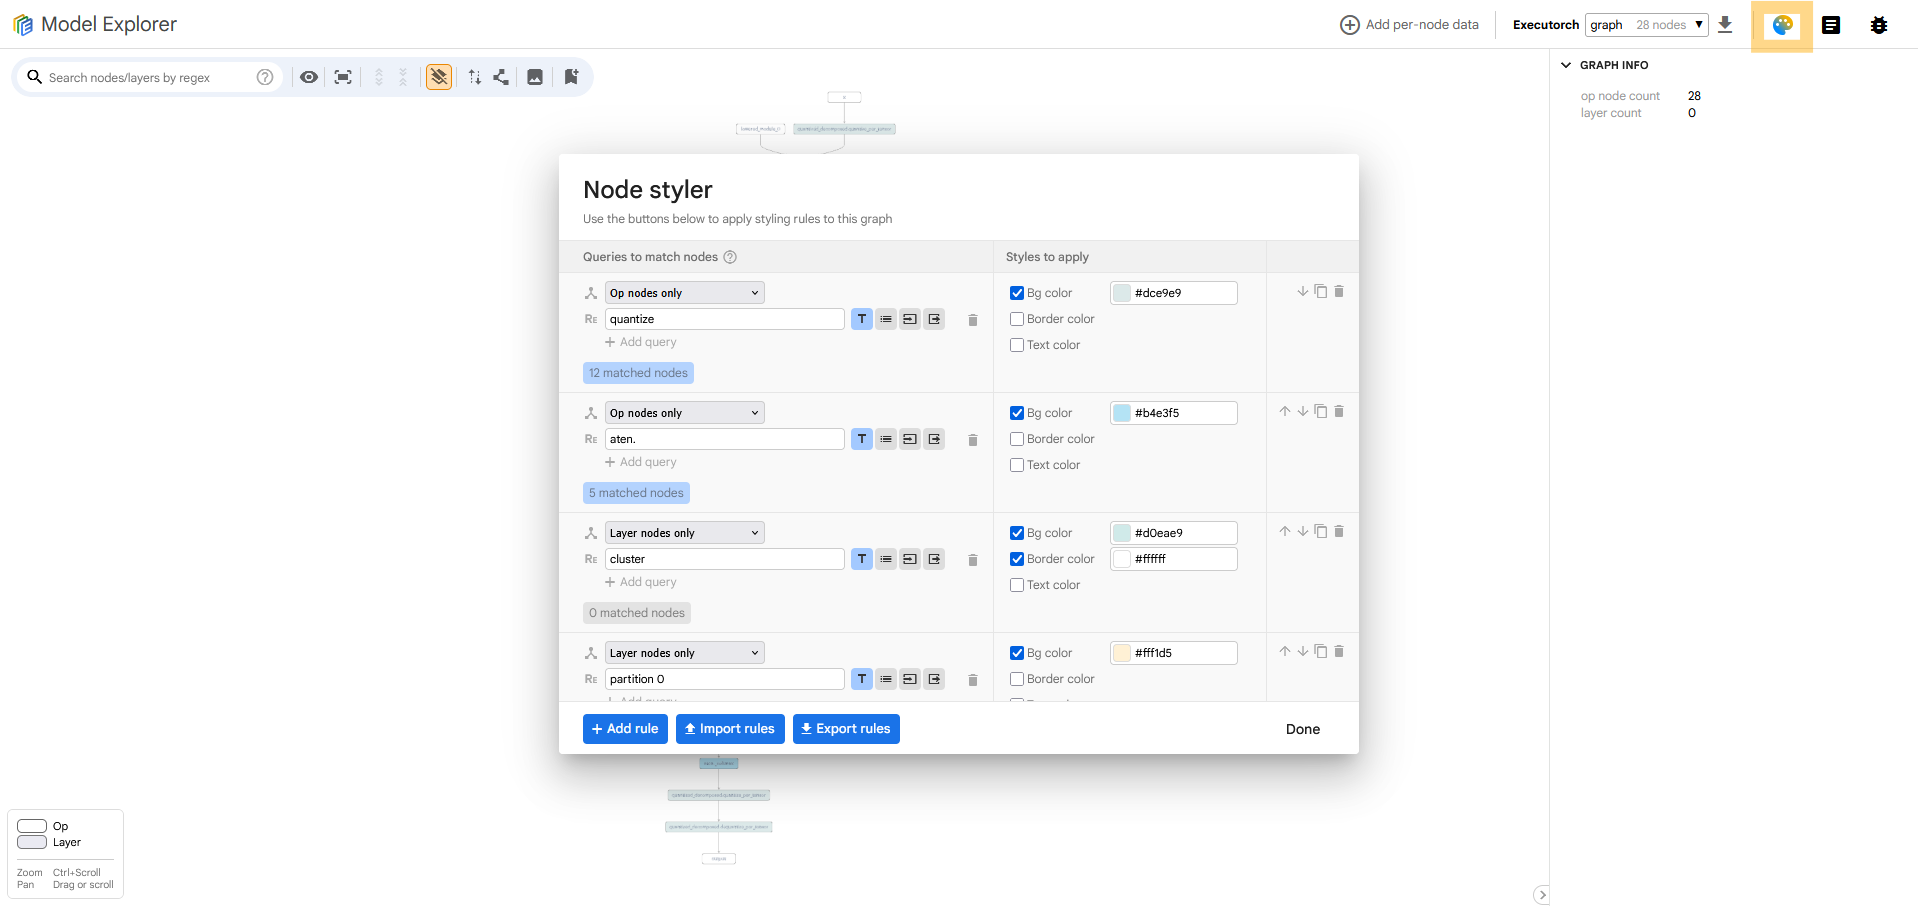
Load a predefined style for QDQ cluster and partition highlighting.#
A color style for the QDQ cluster and partition highlighting is already provided in devtools/visualization/model_explorer_styles/cluster_highlight_style.json. To load it follow these steps:
Click the palette icon in the top-right corner of the
ModelExplorerinterface.Click Import rules.
Select the cluster_highlight_style.json file to apply predefined styles that highlight each partition in a different color.